When working with videos, you should be focusing all your efforts on best quality of streaming, less bandwidth usage, and low latencyin order to deliver the best experience for the users.
This is not an easy task. You often need to test different bitrates, encoder parameters, fine tune your CDN and even try new codecs. You usually run a process of testing a combination of configurations and codecs andcheck the final renditions with your naked eyes. This process doesn’t scale, can’t we just trust computers to check that?
bit rate (bitrate): is a measure often used in digital video, usually it is assumed the rate of bits per seconds, it is one of the many terms used in video streaming.
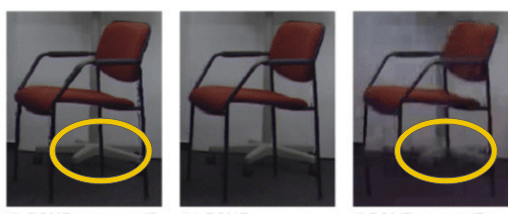
same resolution, different bitrates.
codec: is an electronic circuit or software that compresses or decompresses digital content. (ex: H264 (AVC), VP9, AAC (HE-AAC), AV1 and etc)
We were about to start a new hack day session here at Globo.com and since some of us learned how to measure the noise introduced when encoding and compressing images, we thought we could play with the stuff we learned by applying the methods to measure video quality.
We started by using the PSNR (peak signal-to-noise ratio) algorithm which can be defined in terms of the mean squared error (MSE) in decibel scale.
PSNR: is an engineering term for the ratio between the maximum possible power of a signal and the power of corrupting noise.
First, you calculate the MSE which is the average of the squares of the errors and then you normalize it to decibels.
This file contains hidden or bidirectional Unicode text that may be interpreted or compiled differently than what appears below. To review, open the file in an editor that reveals hidden Unicode characters. Learn more about bidirectional Unicode characters
For 3D signals (colored image), your MSE needs to sum all the means for each plane (ie: RGB, YUV and etc) and then divide by 3 (or 3 * MAX ^ 2).
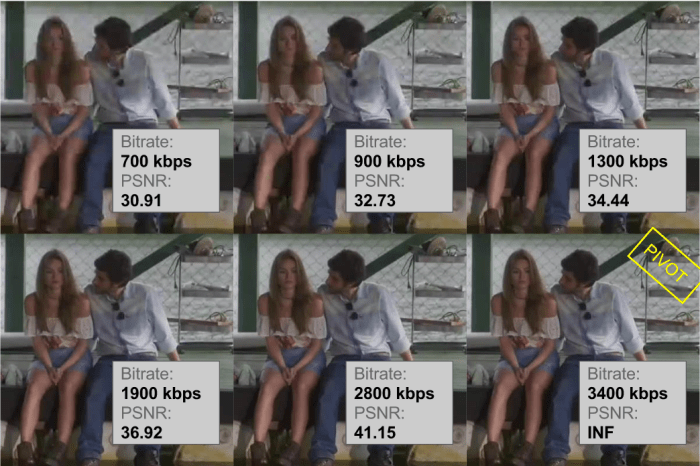
To validate our idea, we downloaded videos (720p, h264) with the bitrate of 3400 kbps from distinct groups like News, Soap Opera and Sports. We called this group of videos the pivots or reference videos. After that, we generated some transrated versions of them with lower bitrates. We created 700 kbps, 900 kbps, 1300 kbps, 1900 kbps and 2800 kbps renditions for each reference video.
Heads Up! Typically the pivot video (most commonly referred to as reference video), uses a truly lossless compression, the bitrate for a YUV420p raw video should be 1280x720x1.5(given the YUV420 format)x24fps /1000 = 33177.6KBps, far more than what we used as reference (3400KBps).
We extracted 25 images for each video and calculate the PSNR comparing the pivot image with the modified ones. Finally, we calculate the mean. Just to help you understand the numbers below, a higher PSNR means that the image is more similar to the pivot.
700 kbps
900 kbps
1300 kbps
1900 kbps
2800 kbps
3400 kbps
Soap Op.
35.0124
36.5159
38.6041
40.3441
41.9447
∞
News
28.6414
30.0076
32.6577
35.1601
37.0301
∞
Sports
32.5675
34.5158
37.2104
39.4079
41.4540
∞
A visual sample.
We defined a PSNR of 38 (from our observations) as the ideal but then we noticed that the News group didn’t meet the goal. When we plotted the News data in the graph we could see what happened.
The issue with the video from the News group is that they’re a combination of different sources: External traffic camera with poor resolution, talking heads in a studio camera with good resolution and quality, some scenes with computer graphics (like the weather report) and others. We suspected that the News average was affected by those outliers but this kind of video is part of our reality.
The different video sources are visible in clusters. (PSNR(frames))
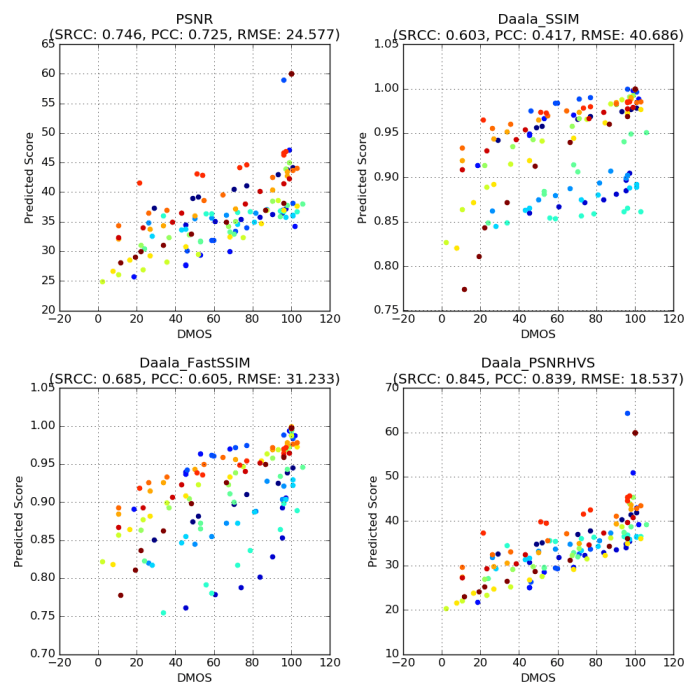
We needed a better way to measure the quality perception so we searched for alternatives and we reached one of the Netflix’s posts: an approach toward a practical perceptual video quality metric (VMAF). At first, we learned that PSNR does not consistently reflect human perception and that Netflix is creating ways to approach this with the VMAF model.
They created a dataset with several videos including videos that are not part of the Netflix library and put real people to grade it. They called this score of DMOS. Now they could compare how each algorithm scores against DMOS.
FastSSIM, PSNRHVS, PSNR and SSIM (y) vs DMOS (x)
They realized that none of them were perfect even though they have some strength in certain situations. They adopted a machine-learning based model to design a metric that seeks to reflect human perception of video quality (a Support Vector Machine (SVM) regressor).
The Netflix approach is much wider than using PSNR alone. They take into account more features like motion, different resolutions and screens and they even allow you train the model with your own video dataset.
“We developed Video Multimethod Assessment Fusion, or VMAF, that predicts subjective quality by combining multiple elementary quality metrics. The basic rationale is that each elementary metric may have its own strengths and weaknesses with respect to the source content characteristics, type of artifacts, and degree of distortion. By ‘fusing’ elementary metrics into a final metric using a machine-learning algorithm – in our case, a Support Vector Machine (SVM) regressor”
The best news (pun intended) is that the VMAF is FOSS by Netflix and you can use it now. The following commands can be executed in the terminal. Basically, with Docker installed, it installs the VMAF, downloads a video, transcodes it (using docker image of FFmpeg) to generate a comparable video and finally checks the VMAF score.
This file contains hidden or bidirectional Unicode text that may be interpreted or compiled differently than what appears below. To review, open the file in an editor that reveals hidden Unicode characters. Learn more about bidirectional Unicode characters
You saved around 1.89 MB (37%) and still got the VMAF score 94.
This file contains hidden or bidirectional Unicode text that may be interpreted or compiled differently than what appears below. To review, open the file in an editor that reveals hidden Unicode characters. Learn more about bidirectional Unicode characters
Using a composed solution like VMAF or VQM-VFD proved to be better than using a single metric, there are still issues to be solved but I think it’s reasonable to use such algorithms plus A/B tests given the impractical scenario of hiring people to check video impairments.
A/B tests: For instance, you could use X% of your user base for Y days offering them the newest changes and see how much they would reject it.